

Production figures can look impressive until they are placed beside the actual pipe specification, operating hours, material consumption, and rejected volume behind them. A factory producing 900 kg of polyethylene per hour is not necessarily more productive than one producing 750 kg/h. This is especially true if the first line consumes substantially more energy or generates more off-specification material.
PE pipe extrusion line benchmarking is most useful when output, energy, scrap, and dimensional quality are evaluated together. DEKUMA provides extrusion systems with published throughput data across several screw sizes, offering a useful reference for understanding how machine capacity should be interpreted rather than viewed as a single headline number.
Comparing Output by Pipe Size
Extrusion throughput cannot be separated from pipe diameter and wall thickness. Larger pipes require substantially more polymer per meter, so kilograms per hour may rise even though the linear production speed becomes much lower. A meaningful benchmark should record both mass output and meters produced, then relate those figures to the pipe’s outside diameter, SDR, material grade, and specification.
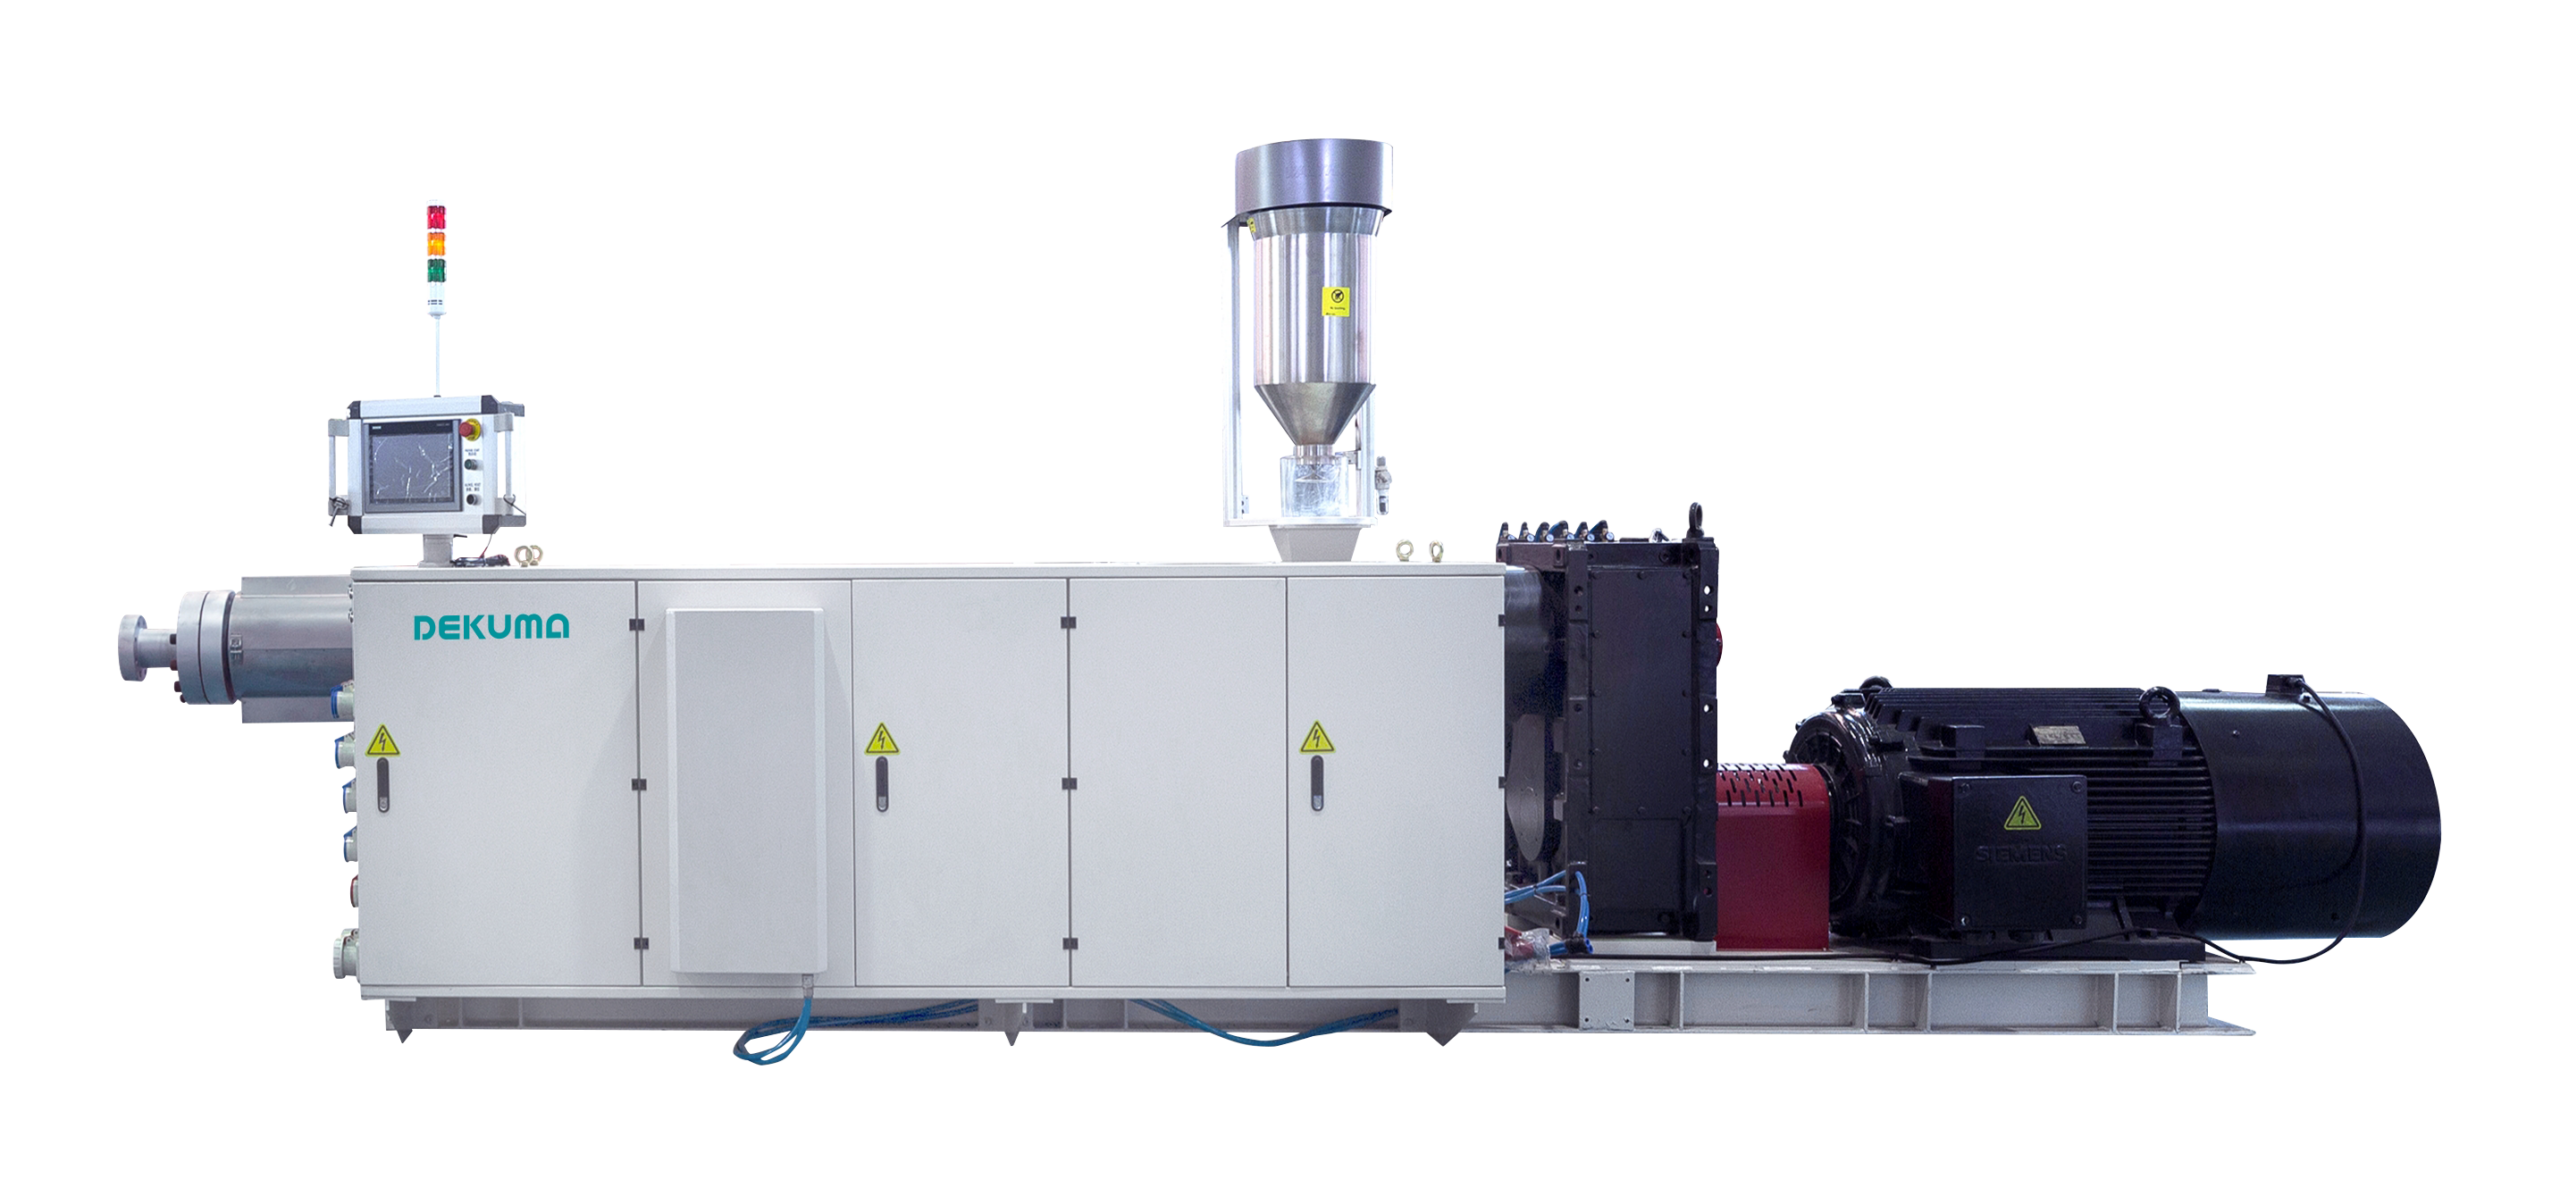
The available equipment data illustrates this relationship clearly. DEKUMA lists HDPE/MDPE output of 175–200 kg/h for the DKM-EI45X33 and 970 kg/h for the DKM-EI90X36A, while the DKM-EI150X36A is listed at 1,800 kg/h. These figures represent machine output under stated conditions, not a universal production rate for every pipe size or resin formulation.
A PE extruder should consequently be benchmarked against comparable equipment and comparable products. Comparing a 90 mm screw processing thin-wall small-diameter pipe with another machine producing thick-wall large-diameter pipe can distort the result. The more useful question is whether each line reaches an appropriate stable throughput while maintaining melt quality, dimensional accuracy, and downstream operating conditions.
Measuring Energy and Material Efficiency
Energy intensity is another useful productivity indicator because two facilities can report similar hourly output while having different operating costs. The calculation should normally include the electricity consumed by the extrusion system and relevant downstream equipment over a defined production period, divided by the kilograms of conforming pipe produced. Short test runs can be misleading because startup, shutdown, heating, cooling, and stabilization consume energy without necessarily producing saleable material.
The screw and barrel configuration influences this relationship. The Plastics Pipe Institute explains that polymer heating during extrusion comes substantially from shear generated by the screw and motor system, while barrel zones use controlled heating or cooling to manage processing conditions. Consequently, energy benchmarking should consider screw diameter, L/D ratio, resin type, melt temperature, throughput, and operating speed rather than comparing a single electricity figure across unrelated machines.
Material efficiency deserves equal attention. Resin that becomes rejected pipe represents both material expenditure and processing energy. PPI notes that out-of-specification plastic pipe can in some circumstances be reground and reprocessed, although production facilities still need to distinguish recoverable material from actual scrap when calculating performance. A factory-level benchmark should record resin input, finished conforming output, startup waste, trimming waste, rejected lengths, and material returned to production separately.
Using Scrap and Downtime to Find Bottlenecks
Scrap percentage can reveal weaknesses that hourly output alone hides. A line operating at high nominal throughput may lose its apparent advantage if frequent dimensional deviations, surface defects, unstable melt pressure, or startup rejects reduce the amount of sellable pipe. For this reason, benchmarking should distinguish theoretical machine capacity from sustained good-product output.
The production data from a PE pipe extrusion line should ideally be segmented by product, shift, material batch, and operating condition. If scrap rises only after changing resin grades, the issue may relate to processing parameters rather than mechanical capacity. If rejects increase during speed changes, attention may need to shift toward synchronization between extrusion, sizing, cooling, haul-off, and cutting.
Downtime adds another layer to the analysis. Planned maintenance, die changes, material changes, cleaning, startup stabilization, sensor faults, and unplanned mechanical stoppages should not be grouped into one number. A facility may discover that a modestly slower line produces more saleable kilograms per scheduled hour because it spends less time recovering from process instability.
Turning Benchmark Data Into Improvement Priorities
DEKUMA’s published single-screw range provides nine screw diameters from 45 mm to 150 mm, with 33D, 36D, and 40D L/D configurations available. Its control architecture can use Siemens or B&R systems with real-time data logging, while gravimetric dosing is specified for weight-per-meter control. Such features are relevant to benchmarking because production teams need reliable operating data before they can distinguish equipment limitations from process-management problems.
A useful benchmark dashboard can rank issues by their effect on conforming production rather than simply highlighting the lowest-performing machine. One line may need attention because its energy per kilogram is high; another may have acceptable energy use but excessive startup scrap; a third could have strong throughput but frequent downtime during product changes. The corrective action should follow the dominant loss mechanism identified from the data.
Historical comparison is equally important. A facility can establish baseline performance for each pipe family, then track changes after screw optimization, cooling adjustments, haul-off synchronization, maintenance work, or control-system improvements. The goal is not to chase the largest possible throughput number but to identify the combination of output, material utilization, energy consumption, quality, and uptime that fits the factory’s actual production requirements.
Conclusion
Reliable productivity benchmarking requires more than placing one machine’s kg/h beside another manufacturer’s specification. PE extruder performance becomes meaningful only after pipe geometry, resin, operating conditions, energy consumption, scrap, downtime, and conforming output are considered together. DEKUMA publishes machine configurations and output ranges that can serve as technical reference points, including HDPE/MDPE capacities from 175–200 kg/h on the DKM-EI45X33 up to 1,800 kg/h on the DKM-EI150X36A. With that broader measurement framework, production teams can identify whether their next improvement should target throughput, process stability, material utilization, energy intensity, or equipment availability rather than relying on a single productivity figure.
